BTC Technical Analysis Feb 18, 2018
Bitcoin is in a major technical zone. Will BTC turn bearish? Stay Bullish? BTC technical analysis on Feb. 18, 2018


Bitcoin is in a major technical zone. Will BTC turn bearish? Stay Bullish? BTC technical analysis on Feb. 18, 2018
The downside pressure in BTC is still strong but we are getting over extended. With the RSI oversold and price being far extended from the 20MA, will Wednesday which brings a red 9 on the time analysis bring a bottom or at the very least a bounce?
BTC is still looking bearish. Will Bitcoin make a run to test January 2018 lows?
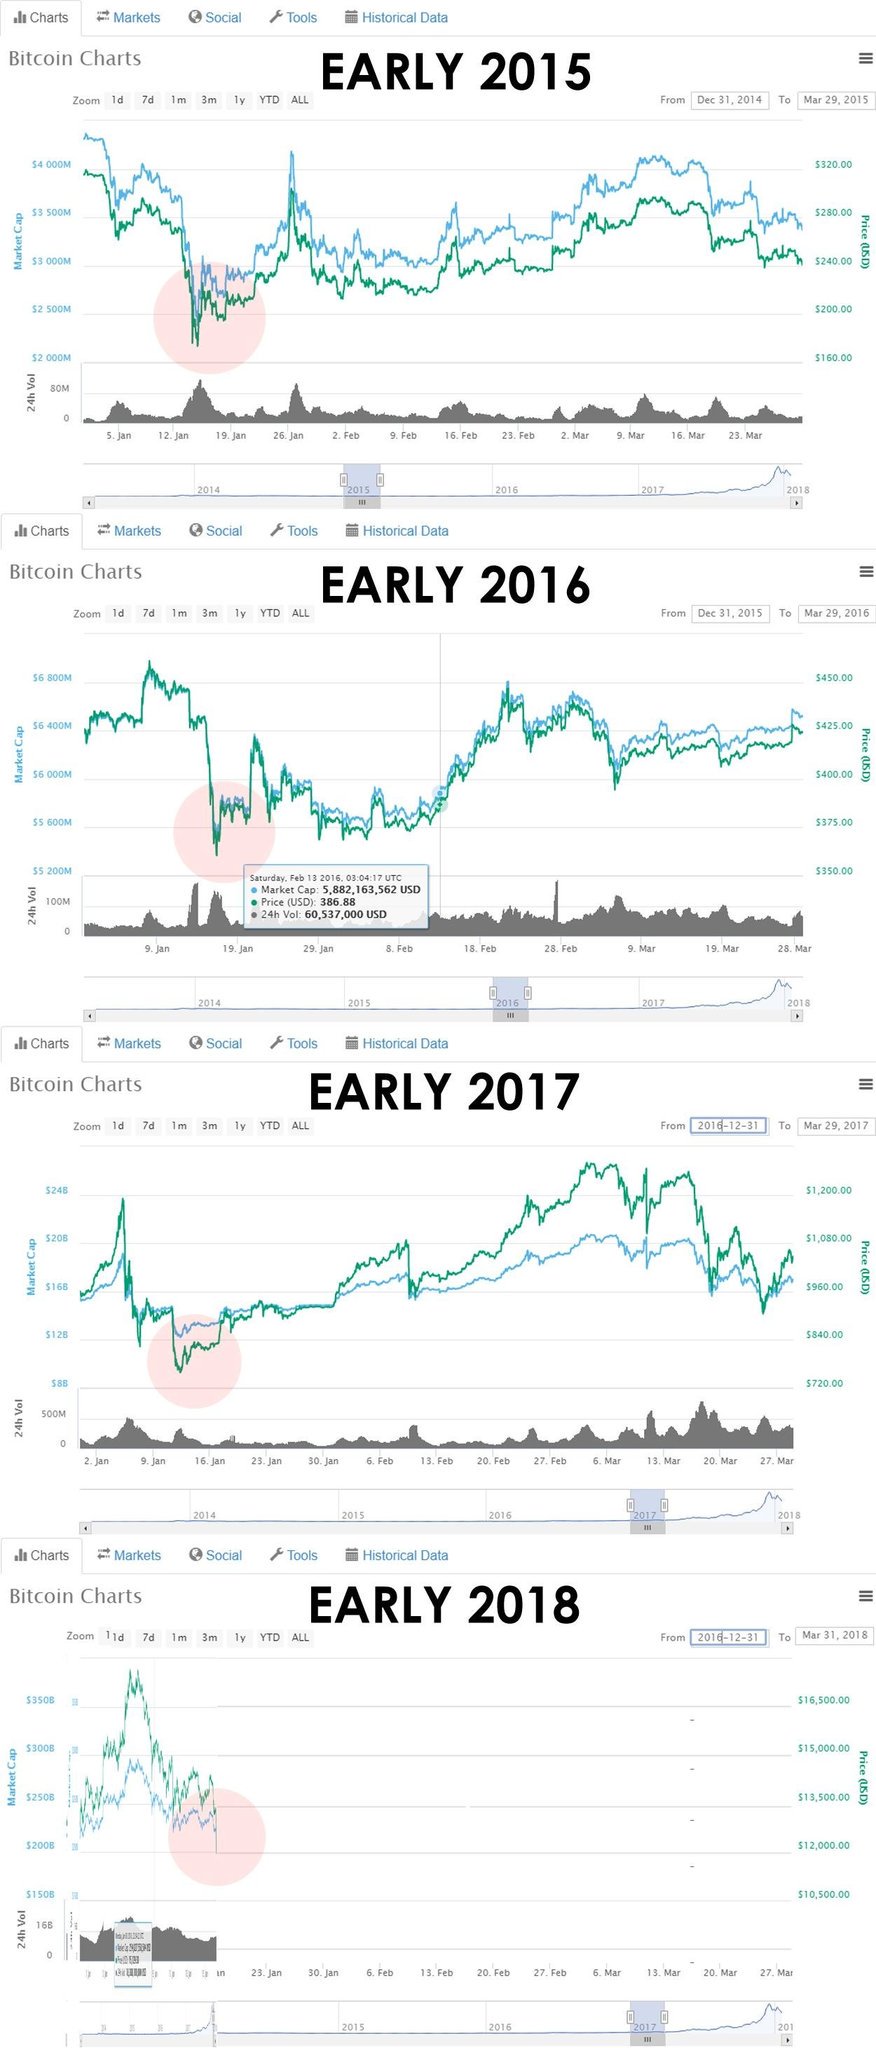
Is this the bottom for BTC? I check out historical BTC charts from 2015, 2016, 2017 which all saw a huge drop leading to a bounce in the middle of January.
BTC price is at the lower BB, a spot from which Bitcoin price has turned around and pushed higher over the last 2 weeks. Is this the short term bottom for BTC?
BTC futures are now live. Will Bitcoin futures push BTC price to new highs?
BTC price has broken above the down trend line from the last couple of days. With futures releasing today will BTC soar to new all time highs?
What is going on with BTC price? Will Bitcoin price hit $20,000 or crash by the end of 2017?
BTC chart time indicators on the daily, weekly, and monthly charts are all on 9 which usually means it is time for a turnaround, in this case a sell off. Will BTC drop?
Bitcoin hits over $11,000 but time analysis is signaling a BTC selloff in the next couple of hours. I break down the Bitcoin chart. Is it time to sell Bitcoin?